
Overview
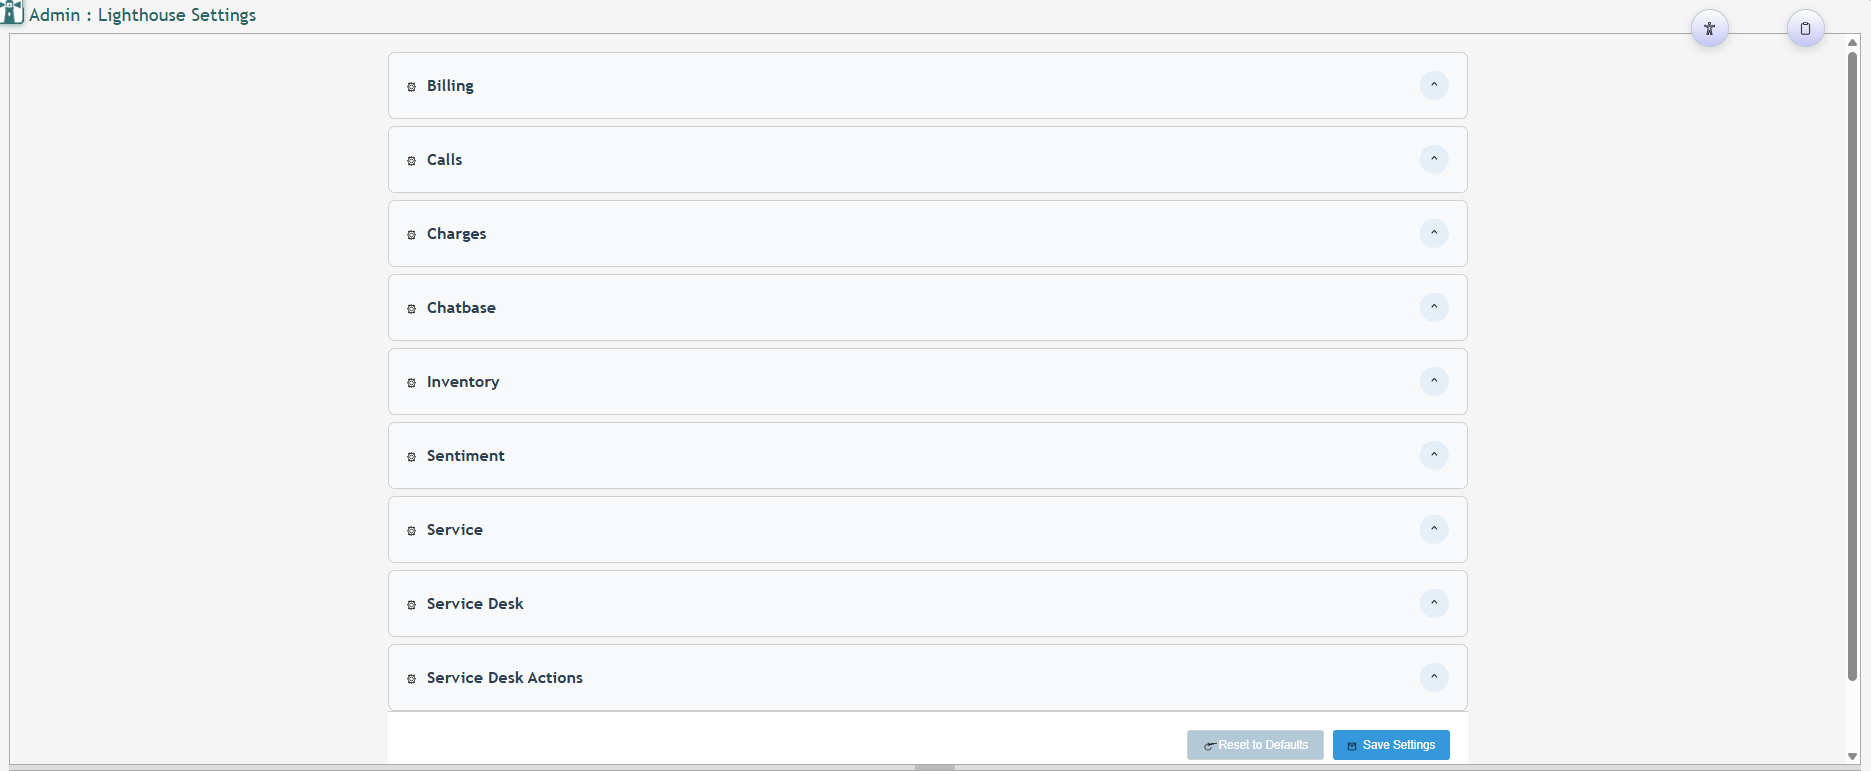
From the Admin Menu, Lighthouse Settings allows an administrator to update the settings Lighthouse uses for its features related to Billing, Calls, Charges, Chatbase, Inventory, Sentiment, Services, and Service Desk items.
To apply multiple changes to settings at once, click the 
Once changes are made, a User can click 
Billing Settings
After updating these settings, click 
Trends
-
Months Back: Number of months to look back when analyzing billing trends
-
Forecast Periods: Number of future periods to forecast for billing trend predictions
-
Event Frequency: Frequency of events for billing trend analysis (daily, weekly, monthly)
-
Event Start: Start date for billing trend analysis. Setting a date creates an event, clearing the date removes the event.
Anomalies
-
Months Back: Number of months to look back when detecting billing anomalies
-
Contamination: Contamination level for billing anomaly detection (0.0-1.0, where 0.05 = 5%)
-
Event Frequency: Frequency of events for billing anomaly detection (daily, weekly, monthly)
-
Event Start: Start date for billing anomaly detection. Setting a date creates an event, clearing the date removes the event.
Calls Settings
After updating these settings, click 
Trends
-
Months Back: Number of months to look back when analyzing call trends
-
Forecast Periods: Number of future periods to forecast for call trend predictions
-
Event Frequency: Frequency of events for call trend analysis (daily, weekly, monthly)
-
Event Start: Start date for call trend analysis. Setting a date creates an event, clearing the date removes the event.
Anomalies
-
Months Back: Number of months to look back when detecting call anomalies
-
Contamination: Contamination level for call anomaly detection (0.0-1.0, where 0.05 = 5%)
-
Event Frequency: Frequency of events for call anomaly detection (daily, weekly, monthly)
-
Event Start: Start date for call anomaly detection. Setting a date creates an event, clearing the date removes the event.
Charges Settings
After updating these settings, click 
Trends
-
Months Back: Number of months to look back when analyzing charge trends
-
Forecast Periods: Number of future periods to forecast for charge trend predictions
-
Event Frequency: Frequency of events for charge trend analysis (daily, weekly, monthly)
-
Event Start: Start date for charge trend analysis. Setting a date creates an event, clearing the date removes the event.
Anomalies
-
Months Back: Number of months to look back when detecting charge anomalies
-
Contamination: Contamination level for charge anomaly detection (0.0-1.0, where 0.05 = 5%)
-
Event Frequency: Frequency of events for charge anomaly detection (daily, weekly, monthly)
-
Event Start: Start date for charge anomaly detection. Setting a date creates an event, clearing the date removes the event.
Chatbase Settings
After updating these settings, click 
-
API Key: Your Chatbase API key for authenticating requests to the Chatbase service
-
Secret Key: Your Chatbase secret key for secure authentication and JWT token generation
-
Chatbots:
-
Assistance: Chatbot ID for the assistance chatbot that helps users with general queries
-
Query Builder: Chatbot ID for the query builder chatbot that helps construct database queries
-
-
URLs:
-
API: Base URL for Chatbase API endpoints for sending chat requests
-
Assistance: URL for embedding the assistance chatbot in an iframe
-
Query Builder: URL for embedding the query builder chatbot in an iframe
-
JWT Expiry: JWT token expiration time in seconds (10 minutes default)
-
Max Prompt Length: Maximum character length allowed for chat prompts to prevent API limits
-
History Days: Number of days to keep Chatbase history data (default 90)
-
Inventory Settings
After updating these settings, click 
Trends
-
Months Back: Number of months to look back when analyzing inventory trends
-
Forecast Periods: Number of future periods to forecast for inventory trend predictions
-
Event Frequency: Frequency of events for inventory trend analysis (daily, weekly, monthly)
-
Event Start: Start date for inventory trend analysis. Setting a date creates an event, clearing the date removes the event.
Anomalies
-
Months Back: Number of months to look back when detecting inventory anomalies
-
Contamination: Contamination level for inventory anomaly detection (0.0-1.0, where 0.05 = 5%)
-
Event Frequency: Frequency of events for inventory anomaly detection (daily, weekly, monthly)
-
Event Start: Start date for inventory anomaly detection. Setting a date creates an event, clearing the date removes the event.
Sentiment Settings
After updating these settings, click 
-
Sprite URL: Path to the sprite image containing sentiment analysis icons
-
Icon Size: Size in pixels for sentiment analysis icons
-
Scale: Scale factor for sentiment icons (0.4 = 40% of original size)
-
Positions:
-
POSITIVE
-
X: X coordinate for positive sentiment icon in the sprite
-
Y: Y coordinate for positive sentiment icon in the sprite
-
-
NEUTRAL
-
X: X coordinate for neutral sentiment icon in the sprite
-
Y: Y coordinate for neutral sentiment icon in the sprite
-
-
NEGATIVE
-
X: X coordinate for negative sentiment icon in the sprite
-
Y: Y coordinate for negative sentiment icon in the sprite
-
-
UNKNOWN
-
X: X coordinate for unknown sentiment icon in the sprite
-
Y: Y coordinate for unknown sentiment icon in the sprite"
-
-
Service Settings
After updating these settings, click 
Trends
-
Months Back: Number of months to look back when analyzing service trends
-
Forecast Periods: Number of future periods to forecast for service trend predictions
-
Event Frequency: Frequency of events for service trend analysis (daily, weekly, monthly)
-
Event Start: Start date for service trend analysis. Setting a date creates an event, clearing the date removes the event.
Anomalies
-
Months Back: Number of months to look back when detecting service anomalies
-
Contamination: Contamination level for service anomaly detection (0.0-1.0, where 0.05 = 5%)
-
Event Frequency: Frequency of events for service anomaly detection (daily, weekly, monthly)
-
Event Start: Start date for service anomaly detection. Setting a date creates an event, clearing the date removes the event.
Service Desk Settings
After updating these settings, click 
Trends
-
Months Back: Number of months to look back when analyzing service desk trends
-
Forecast Periods: Number of future periods to forecast for service desk trend predictions
-
Event Frequency: Frequency of events for service desk trend analysis (daily, weekly, monthly)
-
Event Start: Start date for service desk trend analysis. Setting a date creates an event, clearing the date removes the event.
Anomalies
-
Months Back: Number of months to look back when detecting service desk anomalies
-
Contamination: Contamination level for service desk anomaly detection (0.0-1.0, where 0.05 = 5%)
-
Event Frequency: Frequency of events for service desk anomaly detection (daily, weekly, monthly)
-
Event Start: Start date for service desk anomaly detection. Setting a date creates an event, clearing the date removes the event.
Service Desk Actions Settings
After updating these settings, click 
Trends
-
Months Back: Number of months to look back when analyzing service desk trends
-
Forecast Periods: Number of future periods to forecast for service desk trend predictions
-
Event Frequency: Frequency of events for service desk trend analysis (daily, weekly, monthly)
-
Event Start: Start date for service desk trend analysis. Setting a date creates an event, clearing the date removes the event.
Anomalies
-
Months Back: Number of months to look back when detecting service desk anomalies
-
Contamination: Contamination level for service desk anomaly detection (0.0-1.0, where 0.05 = 5%)
-
Event Frequency: Frequency of events for service desk anomaly detection (daily, weekly, monthly)
-
Event Start: Start date for service desk anomaly detection. Setting a date creates an event, clearing the date removes the event.