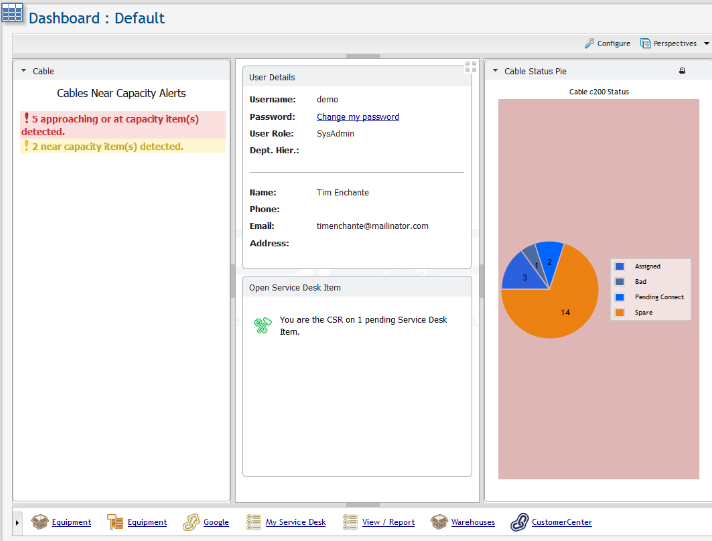
Managing Items on the Dashboard
Once the Dashboard contains widgets and charts/graphs, the User can organize the Dashboard as desired.

The center and top panes can be expanded into 'full-screen mode' by clicking on the expand button. ![]() You may return to the normal viewing mode by clicking this icon again or by pressing the 'Esc' key.
You may return to the normal viewing mode by clicking this icon again or by pressing the 'Esc' key.
By clicking the 'Configure' button on the Grid Toolbar above the top-right corner of the Dashboard, the User can drag and drop widgets and charts/graphs to any available space on the Dashboard. As was described in Dashboard Configuration, the margins of widgets, charts, and graphs can be easily expanded or contracted.
The 'Edit Refresh Rate' button allows you to change how often the data on the dashboard is automatically refreshed.
Once the Dashboard is configured to the User's satisfaction, click the 'Done' button located on the Grid Toolbar above the top-right corner of the Dashboard.
The current dashboard configuration may be saved as a perspective by clicking the 'save new perspective' option under the 'Perspectives' drop-down menu. Perspectives may be opened, shared, and managed through the Perspectives form.
At any point, Users can also reset the Dashboard to its original state by clicking 'Configure' and then selecting 'Reset to Default'.
