PCR-360 has a number of grids for displaying Service Desk metrics. Utilizing these grids, Users can generate Perspectives to be used for running Reports. For more details on the features of a grid, see the Critical Interface: The Grid page.
Scheduling Reports with Perspectives
Click the button.
Select the Perspective the schedule should be based off of, from the My Perspectives section of the form.
Click the button.
Set the Frequency, Next Run Date, File Type, and the emails to send that Report to the desired values and click thebutton.
Manually Running Reports
Clicking the button on the desired grid view.
Configured the settings for the Report.
Click the button.
Service Desk Reports
Actions: A report displaying all Service Desk Actions.
Workflow: A report on all Service Desk Workflow. This report also includes:
Completed On Time: A yes or no value indicating whether the workflow was completed by the due date.
Reported Worked Time: The amount of time work was done on the workflow based on the work start and complete dates
Actual Worked Time: The amount of time work was done on the workflow based on when the workflow was created and completed.
Time On Hold: The amount of time the workflow was on hold.
SLA Metrics: A report on Service Desk SLA Metrics. Included metrics in the report include whether the Service Desk item was completed on time, whether the Workflow was completed on time and whether it was finalized on time.
SLA Workflow Metrics: This report displays Service Desk Workflow and includes columns that indicate if the workflow was completed on time, the Service Desk item was completed on time, and the Service Desk item was finalized on time.
Contacts: The contacts report displays information for each contact on a Service Desk item.
Cable: A report of the cabling items attached to Service Desk items.
Labor: A report of labor on Service Desk items.
Charges: A report of charges on Service Desk items.
Equipment: A report of equipment on Service Desk items.
Gathering Overall Quantity Counts
There are two different ways to generate a quick summary of counts of whatever metrics a User is trying to track.
Report Summary
Generate Report
When a User manually runs a Report with the button, they have the ability to summarize the data using a variety of options. By selecting the "Total (Summary Only)" option, all numeric fields in the Report will be totaled. If a User desires to have totals of a specific non-numeric field, such as 'Service Catalog' or 'SD Status', it is recommended to create a new Perspective for each value to be tracked, so that it all other values are removed from the Report, leaving the summary to only contain counts of that specific value's fields.
Example
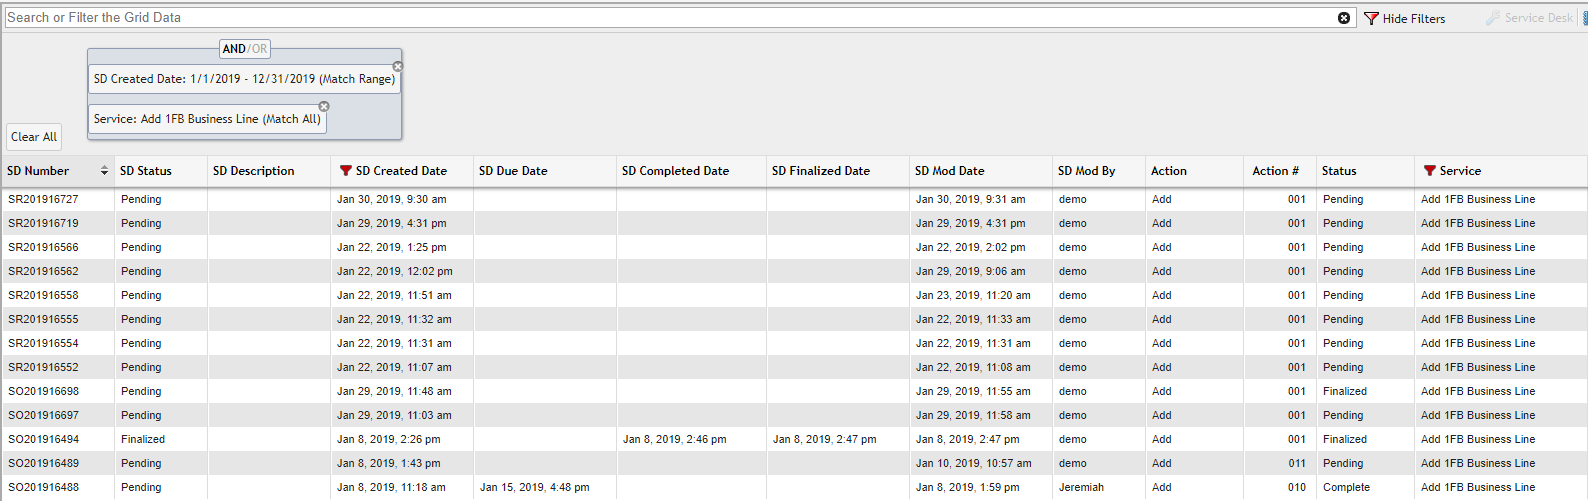
To how many new 'Services' were requested for a specific 'Service Catalog', created over the current year, first, a User must build the desired Perspective.
Report Summary
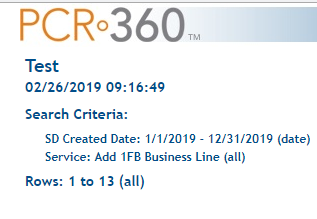
When the Report is run, the header will contain the number of records found:
Example of a Report Header
SQL COUNT Function
By utilizing either Ad Hoc Grids or by calling the SQL Endpoint of the API, a User can utilize the SQL COUNT function to count the number of instances of a specific value for a field within a defined range of records.
Example Reports
Fiscal Year perspective
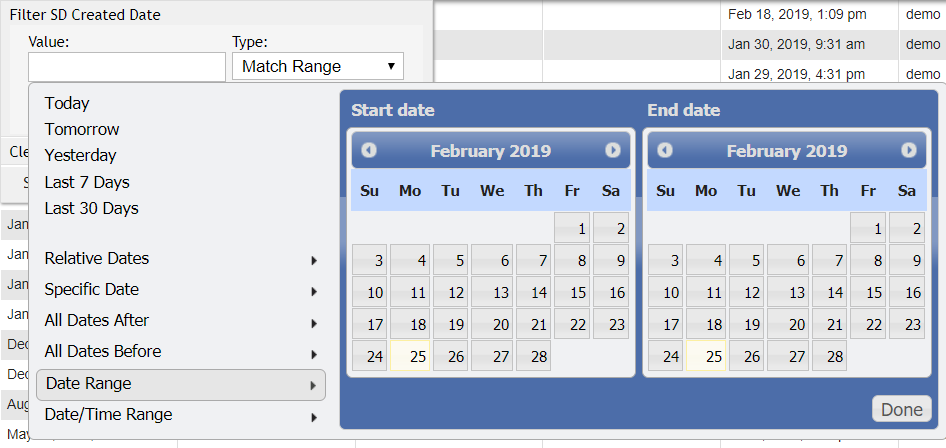
Data Filter by Range
Using the 'Date Range' filter for a Fiscal Year, a User can generate a Report for all items that might have been Created or Completed during their Organizations defined Fiscal Year. Using this filter to sort data would require either yearly updates to the Perspective or a new Perspective for each Fiscal Year the User desires to monitor since the Report is generated based off of a fixed date range.
How many new Services were created?
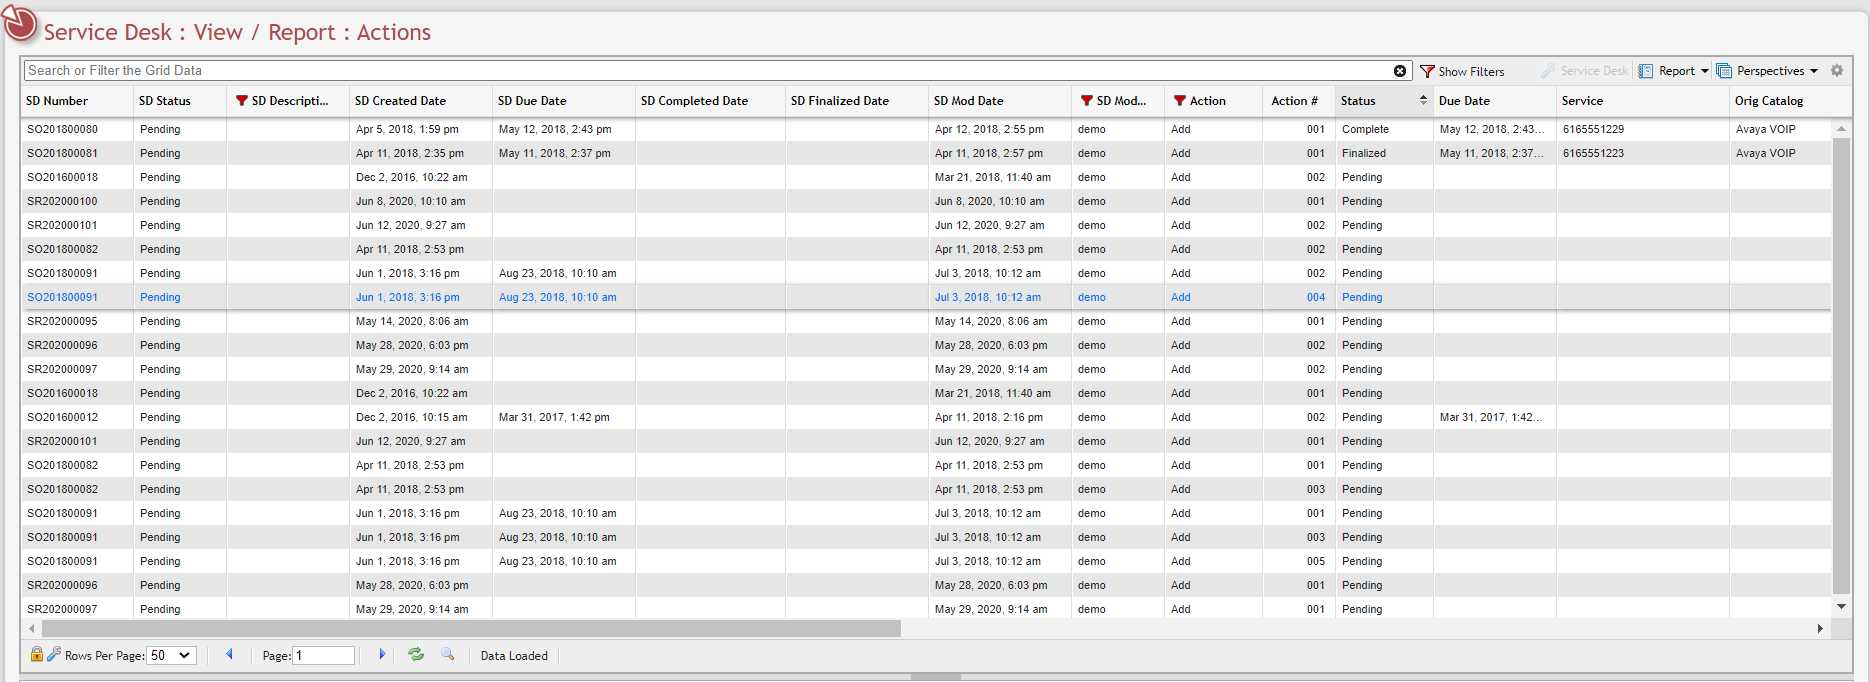
Service Desk Report Actions Grid
All new Services created by Service Desk, originate from a Service Desk 'Add' Action. To view all Actions, a User should navigate to "Main > Service Desk > View/Report > Actions". From this grid, a User would set up a Perspective to filter out any Action that was not an 'Add' as well as any Action that was not in either the 'Completed', 'Finalized' or 'Billed''Status'.
Limitations
Sometimes, a User might desire to generate a Report based on data not available in any of the provided grids within PCR-360, such as looking at all types of Service Desk Items than might have been created for one specific 'Service ID'. In these cases, a User would need to build a view using Ad Hoc Grids to pull all of the desired fields up into the Report.
As a charged service, PCR can write Ad Hoc Grids for your Organization. Please reach out to our Help Desk to make such requests.
JavaScript errors detected
Please note, these errors can depend on your browser setup.
If this problem persists, please contact our support.
 button on the desired grid view.
  button.